
TL;DR:
- Effective restaurant analytics focus on tracking core KPIs like Prime Cost, Food Cost %, and Average Check to inform operational decisions. Consistent data collection, weekly inventory reconciliation, and a tiered review schedule ensure insights translate into action. Most successful operators develop routine habits of weekly KPI reviews, using a small, focused dashboard to drive continuous improvement.
Restaurant analytics is defined as the practice of tracking and interpreting key performance indicators (KPIs) to guide smarter, faster operational decisions. The industry term is restaurant performance analytics, and understanding it does not require a data science degree. You need a POS system, a focused dashboard, and the discipline to review your numbers on a schedule. This guide breaks down the core metrics, how to collect clean data, when to review each KPI, and how to turn those numbers into real decisions that protect your margins and grow your revenue.
What are the core KPIs every restaurant operator must track?
Restaurant KPIs explained simply: they are the handful of numbers that tell you whether your business is healthy or bleeding out. Revenue alone is misleading. A packed dining room does not guarantee profit. These metrics do.
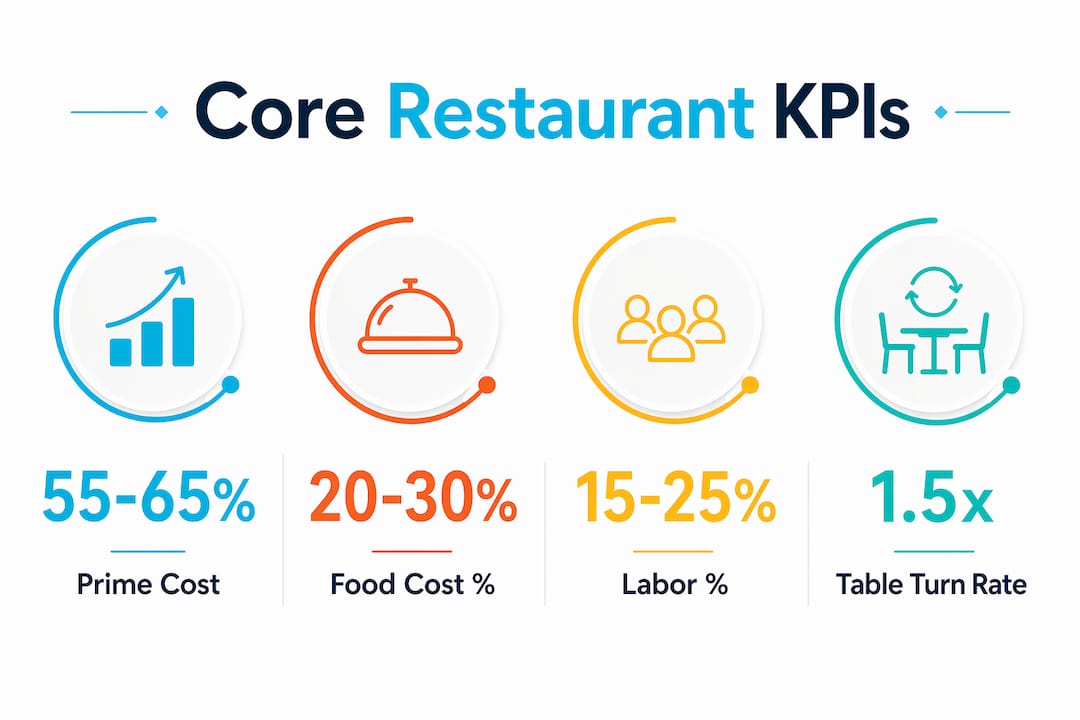
Here are the six non-negotiable KPIs for any US restaurant operator:
- Prime Cost = Cost of Goods Sold (COGS) + Total Labor Cost. This is your single most important number. Prime Cost should stay between 55 and 65% of revenue. Exceeding 70% is unsustainable, regardless of your sales volume.
- Food Cost % = (COGS ÷ Net Sales) × 100. Benchmark: 25 to 28% for quick-service, 28 to 32% for full-service.
- Labor Cost % = (Total Labor ÷ Net Sales) × 100. Tracks whether your scheduling matches your actual revenue.
- Average Check = Net Sales ÷ Number of Covers. Reveals upsell effectiveness and menu pricing performance.
- Sales per Labor Hour (SPLH) = Net Sales ÷ Total Labor Hours. Measures how much revenue each labor hour generates.
- Table Turn Rate = Number of Parties Served ÷ Number of Tables. Indicates floor efficiency during peak service.
Here is a quick reference table to keep these straight:
| KPI | Formula | Benchmark |
|---|---|---|
| Prime Cost | COGS + Labor ÷ Net Sales | 55–65% of revenue |
| Food Cost % | COGS ÷ Net Sales × 100 | 25–32% depending on concept |
| Labor Cost % | Total Labor ÷ Net Sales × 100 | 25–35% depending on concept |
| Average Check | Net Sales ÷ Covers | Varies by concept |
| SPLH | Net Sales ÷ Labor Hours | $30–$50+ depending on concept |
| Table Turn Rate | Parties Served ÷ Tables | 2–3x per shift for full-service |
Pro Tip: Start by benchmarking against your own recent history, not industry averages. Your baseline from the last 90 days is more relevant to your specific concept and market than a national average.
How to gather, structure, and ensure accuracy of your restaurant data
Clean data is the foundation of every useful insight. Garbage in, garbage out. Your POS system (Toast, Square for Restaurants, Lightspeed, or similar) is your primary data source. It captures sales, voids, comps, and item-level performance automatically. The problem is not collection. It is consistency.
Follow these steps to build a data structure you can actually trust:
- Standardize your POS categories. Every menu item must be assigned to a consistent category (Food, Beverage, Alcohol, Retail). Inconsistent naming corrupts your food cost analysis and makes trend comparisons impossible.
- Run weekly inventory counts. Consistent reconciliation through weekly inventory counts is the single most effective way to catch variance early. Variance between theoretical and actual food cost is where theft and waste hide.
- Integrate labor data. Connect your scheduling platform (7shifts, HotSchedules, or similar) to your POS or back-office system. Manual labor entry creates errors. Automated pulls create accuracy.
- Reconcile daily before closing. Voids, comps, and discounts must be entered with reason codes every shift. Missing reason codes make your Comp/Void Rate meaningless.
- Consolidate into one dashboard. Whether you use a back-office platform like Restaurant365, MarketMan, or a well-structured Google Sheets template, all data streams should feed one place. Chasing numbers across five systems kills the habit.
Data accuracy and consistency are as critical as the math itself. Inconsistent category names or failure to reconcile inventories compromise every analysis you run downstream.
Pro Tip: Assign one person per location ownership of data entry standards. When everyone “kind of” does it, no one does it right. One owner, one standard, one clean dataset.

What is the best review cadence for restaurant analytics?
Knowing your KPIs is one thing. Reviewing them on the right schedule is what turns data into decisions. A tiered review schedule is the most efficient approach: daily quick checks, weekly trend reviews, and monthly strategic deep dives.
Here is exactly how to structure each interval:
| Cadence | KPIs to Review | Time Required | Goal |
|---|---|---|---|
| Daily | Net Sales, Prime Cost, Labor %, Food Cost %, Comp/Void Rate | 10 minutes | Catch immediate operational issues |
| Weekly | Table Turn Rate, Average Check, Customer Count, RevPASH | 20 minutes | Spot trends, adjust staffing and menu |
| Monthly | CAC, Inventory Variance, Marketing ROI, Break-Even Analysis | 60 minutes | Strategic planning and budget decisions |
Experienced operators use a Monday morning KPI review routine to catch problems before they compound through the week. Prime Cost and a 13-week cash runway reviewed weekly serve as an early warning system. This is not optional for a healthy operation.
Monthly reviews are where you zoom out. Customer Acquisition Cost (CAC) tells you how much you spent to bring in each new guest. Marketing ROI connects your ad spend to actual covers and revenue. Break-Even Analysis tells you the minimum sales volume needed to cover fixed costs. These numbers inform your next quarter’s budget, not your next shift.
Pro Tip: Block these review times in your calendar like a reservation you cannot cancel. Regularly scheduled KPI reviews transform static reports into management muscle. Miss them consistently and your data becomes decoration.
You can also display your daily specials and real-time performance data on digital screens in your restaurant to keep your front-of-house team aligned with operational goals throughout each shift.
How do restaurant analytics translate into real business decisions?
Data-driven restaurant decisions are only valuable when they change behavior. Here is how each KPI category maps to a specific operational action:
Menu optimization. Your POS data reveals your menu mix: which items sell, which items have high margins, and which items do both. Items with low sales AND low margins get cut or repositioned. Items with high margins but low sales get promoted through server training or menu design changes. This is not guesswork. It is math.
Staffing adjustments. When your SPLH drops below your target, you are overstaffed for the volume you are doing. Pull your hourly sales data against your labor schedule. Identify the hours where you are paying for labor that is not generating revenue. Adjust your schedule for the following week. Repeat weekly until your Labor Cost % hits target.
Food waste and theft reduction. A gap between your theoretical food cost (what your recipes say you should spend) and your actual food cost (what you actually spent) signals waste, over-portioning, or theft. Analytics reveals these patterns and strips out assumptions so you can act on facts, not hunches. Weekly inventory counts make this gap visible before it becomes a crisis.
Marketing ROI. Your monthly deep dive should connect marketing spend to actual guest counts and revenue. If you ran a social media campaign and your Customer Count did not move, the campaign did not work. If Average Check increased during a promotion period, it did. Tracking restaurant marketing KPIs alongside operational KPIs gives you the full picture of what is driving revenue.
- Food Cost % over target → audit portion sizes and supplier invoices
- Table Turn Rate declining → review floor layout, server training, or kitchen ticket times
- Average Check dropping → evaluate upsell training and menu pricing
- Customer Count flat → assess marketing spend and repeat visit rate
Pro Tip: If a metric does not lead to a decision, it is noise. Before adding any KPI to your dashboard, ask: “What would I do differently if this number changed?” If you cannot answer that, drop the metric.
Key takeaways
Restaurant analytics basics work when you track the right KPIs, collect clean data, review on a consistent schedule, and connect every number to a specific operational decision.
| Point | Details |
|---|---|
| Prime Cost is your anchor metric | Keep it between 55 and 65% of revenue; above 70% signals an unsustainable operation. |
| Clean data requires discipline | Standardize POS categories, run weekly inventory counts, and assign one person to data ownership. |
| Tiered review cadence drives action | Daily 10-minute checks, weekly 20-minute reviews, and monthly 60-minute deep dives each serve a distinct purpose. |
| Metrics must drive decisions | Track only 10 to 15 core KPIs that change your behavior; more metrics create reporting fatigue, not insight. |
| Analytics connects marketing to revenue | Monthly reviews of CAC and Marketing ROI reveal whether your spend is actually filling seats. |
Why most restaurant owners are doing analytics backwards
Here is what I have seen working with restaurant operators across the US: most owners collect too much data and act on too little of it. They have a POS system, a scheduling platform, and maybe a back-office tool. They generate reports. Those reports sit unread in an inbox until something goes wrong.
The problem is not access to data. The problem is the absence of a decision-making habit built around that data.
I have watched operators obsess over social media impressions while their Prime Cost quietly crept past 68%. Impressions are not a survival KPI. Prime Cost is. The discipline of a Monday morning 10-minute KPI review, every single week without exception, does more for a restaurant’s financial health than any dashboard upgrade or analytics software subscription.
A focused dashboard with 10 to 15 KPIs tailored to your concept prevents data overload and builds the kind of decision-making confidence that compounds over time. Start small. Pick your five most critical numbers. Review them daily for 30 days. Then add the next layer.
The operators who use data well are not the ones with the most sophisticated tools. They are the ones who show up to their numbers every week, ask hard questions, and change something based on the answers. That is the real skill. And it is learnable.
— Doug
How Ionhospitality helps you turn data into more customers
Understanding your numbers is step one. Turning those insights into a full dining room is step two. That is where Ionhospitality comes in.

Ionhospitality is a restaurant marketing and advertising agency built specifically for operators who want more customers, more private event bookings, and more online orders without paying commissions. We connect your operational data to social media advertising strategies that actually move the needle. Whether you need to fill seats on slow nights or sell out your private dining room, we build the campaigns that make it happen. Ready to see what data-driven marketing looks like for your restaurant? Book a discovery call or explore our social media advertising services to get started.
FAQ
What are restaurant analytics basics?
Restaurant analytics basics refer to the practice of tracking a focused set of KPIs, including Prime Cost, Food Cost %, Labor Cost %, and Average Check, to guide daily operational and financial decisions. The goal is to replace gut-feel management with objective, data-driven choices.
How many KPIs should a restaurant track?
Most successful operators track 10 to 15 core KPIs to avoid reporting fatigue. Tracking too many metrics causes managers to ignore reports entirely, which defeats the purpose of analytics.
What is Prime Cost and why does it matter?
Prime Cost is the sum of your Cost of Goods Sold and total labor costs, expressed as a percentage of net sales. It is the most important profitability metric in restaurant operations because it captures your two largest controllable expenses in a single number.
How often should restaurant owners review their KPIs?
Daily 10-minute reviews cover Net Sales and Labor %; weekly 20-minute sessions track Table Turn Rate and Average Check; monthly 60-minute deep dives analyze Marketing ROI and Break-Even Analysis. This tiered review schedule keeps decisions timely and strategic.
What tools do restaurants use for data analysis?
POS systems like Toast, Square for Restaurants, and Lightspeed are the primary data sources. Back-office platforms like Restaurant365 and MarketMan consolidate sales, labor, and inventory data into one place. You can also track marketing results for restaurants using dedicated reporting tools to connect ad spend to actual revenue outcomes.
Add a Comment