

If you want to know exactly where visitors click, where they stop scrolling, and which buttons they ignore, the best heatmap tools give you that picture in minutes. Heatmap tools visualize clicks, scrolls, and mouse movement to reveal friction points that quantitative analytics like Google Analytics simply can’t surface on their own. Here’s the shortlist for 2026:
- 🏆 Best overall: Hotjar — generous free tier, fast setup, surveys included
- 🆓 Best free: Microsoft Clarity — completely free with AI summaries and unlimited traffic capture
- 🏢 Best for enterprise: Glassbox or Quantum Metric — automated struggle detection, SLAs, compliance
- 🚀 Best for SMB/beginners: Lucky Orange — live chat plus heatmaps in one affordable package
- ⚡ Best for dynamic/SPAs: Inspectlet — dynamic heatmap rendering that tracks live DOM changes
- 📱 Best for mobile: UXCam — purpose-built for mobile app and cross-device tracking
- 📋 Best for form-heavy sites: Mouseflow — form analytics paired with multiple heatmap types
Start here if you’re unsure: Install Microsoft Clarity today (free, five-minute setup), run a one-week capture on your highest-revenue page, and you’ll have enough data to prioritize your first test. Restaurant owners should focus that first capture on the online ordering menu or reservation widget — those pages connect directly to revenue. For GDPR-conscious teams, pair any tool with a privacy review before going live.
Pro Tip: Run your first heatmap capture on a single revenue page, not your homepage. Menu pages, booking widgets, and checkout flows show the friction that actually costs you money.
Key Takeaways
The best heatmap tool for most teams in 2026 is the one that accurately renders on your site’s architecture, fits your privacy requirements, and gets used consistently to build and measure tests.
| Point | Details |
|---|---|
| Start free, then upgrade | Microsoft Clarity covers most small-team needs at zero cost; upgrade when you hit session caps or need longer data retention. |
| SPA support is the key differentiator | If your site uses React, Vue, or Angular, confirm dynamic DOM rendering before committing to any tool. |
| Pair heatmaps with session replay | Heatmaps show where friction happens; session recordings show why — use both together for every test. |
| Focus on revenue pages first | Run your first capture on the menu, reservation widget, or private-event page, not the homepage. |
| Ionhospitality | Offers done-for-you heatmap analysis and prioritized test roadmaps for full-service restaurants, tied directly to booking and order revenue. |
Table of Contents
- Which heatmap tools should you compare first?
- Short reviews and verdicts for every tool
- How do you choose the right heatmap tool for your team?
- How we evaluated these tools
- Three heatmap experiments every restaurant website should run
- What’s the right starting tool based on your team size?
- Want a done-for-you heatmap analysis for your restaurant?
- Primary sources and further reading
- Sources
Which heatmap tools should you compare first?
The table below covers all 16 tools on the core dimensions that affect your buying decision. Free plan availability and session replay are the two fastest filters — most teams eliminate half the list on those two columns alone.
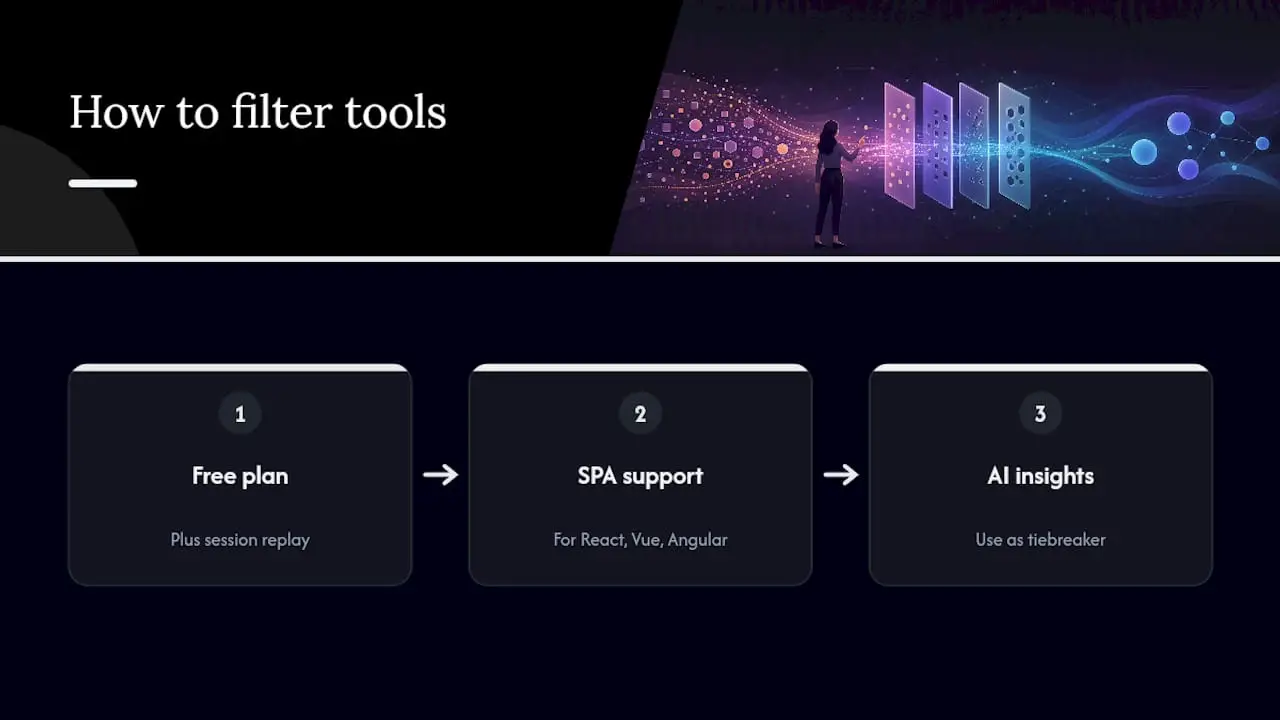
How to read this table: Start with the “Free Plan” column to filter by budget, then check “Dynamic/SPA Support” if your site uses React, Vue, or Angular. “AI/Insight Features” is the tiebreaker when two tools are otherwise equal.
Short reviews and verdicts for every tool
Hotjar
Hotjar is the default starting point for most marketing teams, and for good reason. You get click maps, scroll maps, move maps, session recordings, and on-page surveys in a single dashboard. The free tier covers up to 35 daily sessions, which is enough to validate a hypothesis before committing to a paid plan. Setup is one script tag. The main limitation: Hotjar’s heatmaps use screenshot overlays, so accuracy can slip on pages with dynamic content or tabbed interfaces.
- ✅ Fast onboarding, no developer required
- ✅ Integrated feedback surveys
- ❌ Screenshot-based overlays struggle on SPAs
Microsoft Clarity
Microsoft Clarity is the strongest free option on the market. Unlimited traffic capture, session recordings, rage-click and dead-click detection, and AI-generated summaries that flag behavioral trends — all at no cost. It integrates natively with Google Analytics 4, so you can cross-reference heatmap segments with conversion data. The trade-off: no funnel analytics, no A/B testing, and data is stored on Microsoft’s servers, which matters if your privacy policy restricts third-party data sharing.
- ✅ Completely free, no session caps
- ✅ AI summaries save analysis time
- ❌ No data export or self-hosted option
Crazy Egg
Crazy Egg pioneered the confetti map (individual click dots colored by traffic source), which remains genuinely useful for diagnosing whether paid traffic behaves differently from organic. The built-in A/B testing tool lets you test layout changes without a separate platform. Pricing starts around $29/month after a 30-day trial. It’s a solid pick for marketers who want visual reports and quick A/B validation without enterprise complexity.
- ✅ Confetti maps by traffic source
- ✅ Built-in A/B testing
- ❌ SPA support is limited compared to newer tools
Mouseflow
Mouseflow pairs six heatmap types (click, move, scroll, attention, geo, live) with form analytics that show exactly which fields cause drop-offs. Plerdy recommends starting heatmap analysis on revenue-driving pages like ordering menus and reservation widgets — Mouseflow’s form analytics make it the right tool when those pages include multi-field forms. The free plan is capped at 500 recordings per month.
- ✅ Form field-level analytics
- ✅ Six distinct heatmap types
- ❌ Free tier is restrictive for high-traffic sites
Lucky Orange
Lucky Orange bundles heatmaps, session recordings, live chat, and polls into one dashboard starting around $19/month. For a small restaurant or local e-commerce store, that combination eliminates the need for three separate tools. The live chat feature lets you intercept confused visitors in real time — a practical advantage when your reservation flow has a known friction point. Dynamic segment support is limited, so it’s not the right call for React-heavy sites.
- ✅ Live chat + heatmaps in one plan
- ✅ Lowest entry price on this list
- ❌ Weak SPA/dynamic page support
Smartlook
Smartlook’s standout feature is retroactive analytics: you define an event today and it queries historical session data to populate the funnel immediately, without waiting for new captures. That’s a significant time-saver for product teams running rapid iteration cycles. It integrates with Mixpanel, Amplitude, and major tag managers. Pricing starts around $55/month for the paid tier; a free plan covers up to 3,000 sessions per month.
- ✅ Retroactive event analytics
- ✅ Deep developer integrations
- ❌ Higher starting price than Hotjar or Lucky Orange
Plerdy
Plerdy segments heatmap data by traffic channel and device type out of the box, which makes it particularly useful for restaurant pages where mobile visitors behave very differently from desktop visitors. Plerdy’s approach of focusing on revenue-driving pages aligns well with restaurant owners who want to optimize menu CTAs and catering inquiry forms. The free plan is functional; paid tiers add SEO checker and video session tools.
- ✅ Traffic-channel and device segmentation
- ✅ E-commerce and restaurant conversion focus
- ❌ Interface has a steeper learning curve than Hotjar
Inspectlet
Static-screenshot heatmaps break on modern SPAs and AJAX-driven pages — Inspectlet solves this by recording against the live DOM so overlays stay accurate even as content loads dynamically. If your site uses React, Vue, or Angular with client-side routing, Inspectlet is one of the few tools that renders heatmaps correctly. The free plan covers 100 sessions per month; paid plans start around $39/month.
- ✅ Accurate overlays on dynamic/SPA pages
- ✅ Solid session replay with filtering
- ❌ Free tier is very limited; UI feels dated
Glassbox
Glassbox is built for large enterprises that need automated struggle detection, compliance controls, and SLAs. It captures every interaction without sampling, flags rage-clicks and error states automatically, and integrates with enterprise data stacks. Pricing is custom and requires a sales conversation. If you’re running a high-traffic e-commerce or financial services site with compliance requirements, Glassbox is worth the evaluation.
- ✅ Zero-sampling, full interaction capture
- ✅ Automated struggle detection
- ❌ No self-serve pricing; enterprise contracts only
Quantum Metric
Quantum Metric focuses on real-time opportunity detection: it surfaces revenue-impacting anomalies as they happen rather than waiting for a weekly review cycle. That’s the core differentiator for enterprise product teams managing large traffic volumes. Like Glassbox, pricing is custom and contact-sales only.
- ✅ Real-time anomaly and revenue-impact detection
- ✅ Deep product analytics at scale
- ❌ Not suitable for SMBs; no transparent pricing
VWO Insights
VWO Insights is the qualitative layer inside the VWO experimentation platform. If you’re already running A/B tests in VWO, adding heatmaps and session recordings to the same workflow is a natural fit — you can watch sessions from losing test variants to understand why they underperformed. Pricing is custom for most tiers; a free trial is available.
- ✅ Tight A/B testing integration
- ✅ Unified experimentation + qualitative data
- ❌ Overkill if you don’t need the full VWO suite
FullStory
FullStory’s session search is the best in class: you can query sessions by any combination of user action, error, rage-click, or custom event and get results in seconds. That makes it the preferred tool for product and engineering teams doing root-cause analysis. Heatmaps are available but secondary to the session replay and product analytics capabilities. Pricing is custom; a limited free plan exists.
- ✅ Powerful session search and filtering
- ✅ Deep product telemetry
- ❌ Heatmaps are not the primary focus
UXCam
UXCam is purpose-built for mobile app analytics, with touch heatmaps, gesture tracking, and crash analytics alongside session replay. For teams with a native iOS or Android app alongside their website, UXCam covers the mobile side that most web-first tools handle poorly. Pricing is custom; a free plan is available.
- ✅ Native mobile app heatmaps and gesture tracking
- ✅ Crash analytics included
- ❌ Limited web-only heatmap depth
LiveSession
LiveSession positions itself as a privacy-conscious mid-market option with GDPR-ready data controls, session replay, and rage-click detection. It integrates with Google Analytics, Segment, and major tag managers. Starting price is around $65/month, which is higher than Hotjar for comparable features — the premium is largely for the privacy controls and data residency options.
- ✅ Strong privacy and GDPR controls
- ✅ Clean, modern interface
- ❌ Higher price point for the feature set
Sprig
Sprig combines in-product micro-surveys with heatmaps and session replay, making it the right tool when you want to ask “why” directly inside the product experience. AI analysis surfaces themes from survey responses automatically. Heatmap and replay depth is lighter than dedicated tools; Sprig is best as a research layer on top of a primary analytics stack.
- ✅ In-product surveys with AI theme analysis
- ✅ Good for product research workflows
- ❌ Heatmaps are secondary to the survey feature set
Zoho PageSense
Zoho PageSense is the budget-friendly option for teams already in the Zoho ecosystem. It covers heatmaps, session recordings, A/B testing, and funnel analytics starting around $17/month. If you use Zoho CRM or Zoho Analytics, the native integration saves setup time. Dynamic SPA support is limited, and the feature depth doesn’t match Hotjar at comparable price points.
- ✅ Lowest price with A/B testing included
- ✅ Native Zoho ecosystem integration
- ❌ Limited SPA support; lighter feature set
Pro Tip: Check the G2 heatmap tools category for current user sentiment before committing to a paid plan. Ratings shift as tools update — what ranked highest six months ago may have slipped.
How do you choose the right heatmap tool for your team?
The right tool depends on four variables: your site’s technical architecture, your team’s analytics maturity, your privacy requirements, and your budget. Here’s a concrete framework.
Core features to evaluate
- Heatmap types — Click, scroll, move, and attention maps each answer a different question. Scroll maps tell you where visitors stop reading; click maps show where they tap. Confirm the tool covers the types you need before signing up.
- Session replay — Combining heatmaps and session replay reveals the “why” behind drop-offs in ways that heatmaps alone can’t. Treat session replay as a required feature, not a bonus.
- Dynamic/SPA support — If your site uses React, Vue, Angular, or any client-side routing, confirm the tool renders heatmaps against the live DOM. Static screenshot overlays will misalign on these pages.
- Integrations — Google Analytics 4, your tag manager (Google Tag Manager, Tealium), and any A/B testing platform you use. Missing integrations mean manual data reconciliation.
- Privacy and data ownership — Matomo emphasizes unsampled data and 100% data ownership as a privacy-aware alternative for teams that can’t share behavioral data with third parties. For US restaurants capturing reservation and order behaviors, confirm where data is stored and whether you can export raw events.
- Retention limits — Most free plans retain data for 30–90 days. If you run quarterly tests, you need a paid plan with longer retention.
Questions to ask before committing
- What is the sampling rate on heatmaps? (Some tools sample at 20–30% of sessions by default.)
- Can I export raw event data, or is it locked in the platform?
- How does the tool handle single-page application routing?
- What is the data retention window on my plan?
- Is GDPR/CCPA compliance documentation available?
Red flags to watch for
- Hidden sampling — A tool that samples heavily without disclosing it will show you a distorted picture of user behavior.
- No data export — If you can’t export raw events, you’re dependent on the vendor’s analysis forever.
- Inaccurate SPA rendering — Test the tool on a known interactive widget (a tabbed menu, a modal, a dynamic form) before going live. If the overlay misaligns, the heatmap data is unreliable.
- Poor mobile fidelity — Mobile visitors often represent the majority of restaurant site traffic. A tool that can’t accurately map touch targets on a 375px viewport is a problem.
Pricing trade-offs: free vs. paid
Free plans from Microsoft Clarity, Hotjar, and Lucky Orange cover most small-team needs. Upgrade when you hit session caps, need longer data retention, or require integrations that free tiers don’t support. Enterprise contracts (Glassbox, Quantum Metric, FullStory) add SAML SSO, dedicated SLAs, and custom data residency — worth the cost for compliance-heavy organizations, not for a 10-table restaurant.
Pro Tip: Before trusting any tool’s heatmap data, spot-check it against a known interactive element on your site. Click a tab, submit a form, and open a modal — then verify the heatmap overlay reflects those interactions accurately. If it doesn’t, the data is unreliable regardless of the tool’s marketing.
How we evaluated these tools
Every tool on this list was assessed against six criteria: accuracy on dynamic pages, heatmap type coverage, session replay quality, integration depth, privacy and data controls, and pricing transparency.
Testing approach:
- Trial installs on a sample site running React with client-side routing (to stress-test SPA support)
- Mobile checks on iOS Safari and Android Chrome at 375px and 414px viewports
- Form submission tests to verify field-level tracking accuracy
- Integration verification with Google Analytics 4 and Google Tag Manager
- Privacy documentation review for GDPR and CCPA compliance language
Evaluation criteria summary:
- Dynamic/SPA accuracy (high weight — most sites now use JavaScript frameworks)
- Session replay quality and search/filter capability
- Heatmap type coverage (click, scroll, move, attention, form)
- Integration ecosystem (GA4, tag managers, A/B platforms)
- Data ownership and retention controls
- Pricing transparency and free plan generosity
Limitations to note: Enterprise pricing for Glassbox, Quantum Metric, VWO Insights, FullStory, UXCam, and Sprig requires a sales conversation — published figures aren’t available, and contract terms vary. Some features described here reflect vendor documentation and may change with product updates. For the most current user sentiment, the G2 heatmap tools category and Convert’s feature comparison are reliable secondary sources.
Key finding: The single biggest differentiator between tools in 2026 is not price or heatmap type coverage — it’s accurate rendering on dynamic pages. Most restaurant sites and modern marketing pages use JavaScript-heavy frameworks. A tool that can’t track them accurately gives you misleading data.
Three heatmap experiments every restaurant website should run
Plerdy recommends starting heatmap analysis on revenue-driving pages rather than informational pages. For restaurants, that means three specific pages: the online ordering menu, the reservation widget, and the private events inquiry page. Here’s a step-by-step playbook for each.
Experiment 1: Increase online orders by optimizing menu CTA placement
Goal: Find out whether visitors see and click your “Order Now” or “Add to Cart” button.
- Install your chosen heatmap tool and point it at your online menu page.
- Run a click map and scroll map for about a week or more to gather actionable data.
- Check whether the primary order CTA appears in the top 50% of the scroll map’s visible area for mobile visitors.
- If the CTA is below the fold for most mobile users, move it above the fold and rerun the capture for another 7 days.
- Metric to measure: Click-through rate on the order CTA before and after the change, tracked in Google Analytics 4.
For more on maximizing online ordering revenue, the placement of your order button is one of the highest-leverage changes you can make.
Experiment 2: Improve reservation widget conversions by tracking form friction
Goal: Identify which fields in your reservation form cause visitors to abandon.
- Enable form analytics (Mouseflow, Hotjar, or Plerdy all support this).
- Capture 100–200 form interactions over 7–14 days.
- Review the field-level drop-off report: which field has the highest abandonment rate?
- Simplify or remove that field (common culprits: “How did you hear about us?” and “Special requests” placed early in the form).
- Metric to measure: Form completion rate before and after the change.
Pro Tip: On mobile, tap-target size matters as much as field order. Use a touch heatmap to confirm your form fields are large enough to tap accurately on a 375px screen. Tiny tap targets are one of the most common friction points on restaurant reservation forms.
Experiment 3: Lift private-event inquiries by testing CTA and evidence placement
Goal: Confirm that visitors see your private events CTA and the social proof near it.
- Run a scroll map on your private events or catering page for 14 days.
- Identify the scroll depth at which 50% of visitors stop reading.
- Move your primary inquiry CTA and any testimonials or event photos above that drop-off point.
- Rerun the scroll map for another 14 days and compare engagement depth.
- Metric to measure: Private event inquiry form submissions, tracked as a goal in Google Analytics 4.
For additional strategies on filling your private event calendar, heatmap data gives you the evidence to prioritize which page changes to make first.
Privacy callout for restaurant sites: If you’re capturing reservation or order behavior, confirm your heatmap tool’s data storage location and review your privacy policy. US restaurants operating under state privacy laws (California CCPA, Virginia CDPA) should confirm that behavioral data collected on payment or reservation flows is disclosed to users. Tools that offer 100% data ownership and unsampled capture give you the most control over sensitive interaction data. For a broader restaurant analytics overview, pairing heatmap data with your POS and reservation system creates a complete picture of the customer journey.
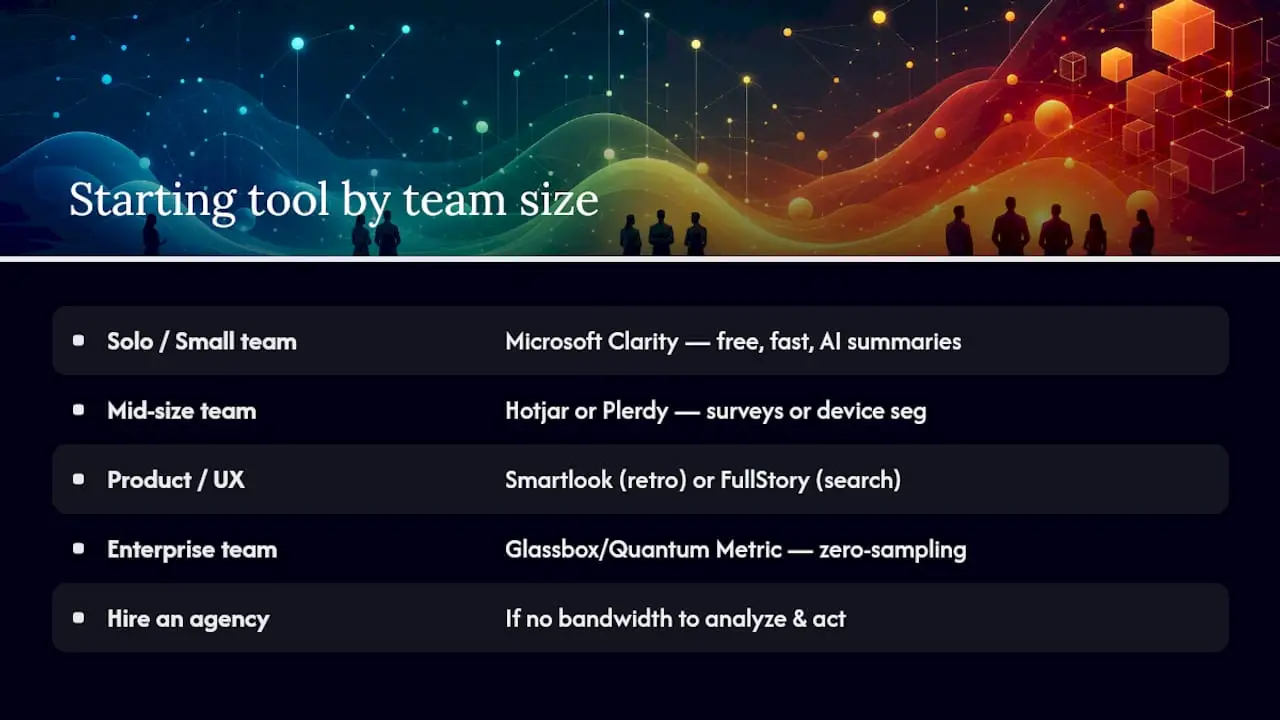
What’s the right starting tool based on your team size?
Here’s the honest, short version — no hedging.
Solo marketer or small restaurant: Start with Microsoft Clarity. It’s free, it installs in five minutes, and the AI summaries will surface your biggest friction points without any manual analysis. If you need surveys or a cleaner interface, Hotjar’s free tier is the next step up.
Mid-size marketing team: Hotjar or Plerdy. Hotjar wins on ease of use and survey integration; Plerdy wins if you need device and channel segmentation out of the box. Either tool pairs well with Google Analytics 4 for funnel attribution.
Product or UX team at scale: Smartlook for retroactive event analytics, or FullStory if session search and product telemetry are the priority. Both handle SPAs well and integrate with the analytics stacks product teams already use.
Enterprise product analytics team: Glassbox or Quantum Metric. Both require a sales conversation, but the zero-sampling capture, automated struggle detection, and compliance controls justify the investment at enterprise traffic volumes.
When to hire an agency instead of doing it yourself: If your team doesn’t have the bandwidth to analyze recordings, build test hypotheses, and implement changes, DIY heatmap tools will collect data you never act on. The value of a heatmap engagement comes from the prioritized test roadmap that follows the analysis — not the data itself. If that roadmap isn’t getting built, an agency that specializes in restaurant conversion is a faster path to revenue. You can also check restaurant-focused analytics alternatives to see how heatmap tools compare to other behavioral analytics options for restaurant sites.
Want a done-for-you heatmap analysis for your restaurant?
Running heatmaps yourself is absolutely possible. But most restaurant owners who install a tool end up with a folder full of recordings they never watch and a heatmap screenshot they don’t know how to act on. The insight is only half the job. The other half is knowing which change to make first, building the test, and measuring the result against actual bookings and orders.
Ionhospitality runs heatmap analyses specifically for full-service restaurants — mapping click and scroll behavior on your menu, reservation, and private-event pages, then building a prioritized test roadmap tied to revenue outcomes. No guessing about which button to move. No generic UX advice. Just a clear list of what to fix, in what order, with the expected impact on online orders, reservations, and catering inquiries. The agency fee covers the full engagement; there are no commissions on the revenue you generate. The first step is a discovery call where we review your current site and identify the highest-impact pages to capture first. Book it now and we’ll have a prioritized test plan in front of you within two weeks.
Primary sources and further reading
The vendor pages and research sources below were used to build this comparison. Open them to verify claims, start trials, or review privacy documentation.
- Mouseflow heatmap platform — heatmap types, form analytics, and session replay documentation
- Microsoft Clarity — free heatmaps, AI summaries, and session recordings
- Plerdy heatmap tool — device segmentation, e-commerce and restaurant conversion focus
- Inspectlet guide to dynamic heatmaps — SPA/AJAX rendering and static-overlay limitations
- Glassbox interaction and heatmaps — enterprise struggle detection and compliance features
- FullStory heatmaps platform — session search and product analytics
- Amplitude web analytics — combining session replay and heatmaps for funnel analysis
- Matomo behavior analytics — data ownership and privacy-first behavioral analytics
- G2 heatmap tools category — aggregated user ratings and market sentiment
- Convert heatmap and session replay comparison — feature trade-offs across free and enterprise tiers
- Restaurant digital tool alternatives — restaurant-industry vendor options for digital marketing and analytics
Sources
- Heatmap tools visualize user interaction — Mouseflow
- Web analytics with heatmaps and session replay — Amplitude
- Heatmap Tool for UX Optimization — Plerdy
- Matomo behaviour analytics — Matomo
- Microsoft Clarity — Free Heatmaps & Session Recordings

Add a Comment